Our tenant satisfaction survey
Each year we employ a specialist research company to ask a random sample of tenants what they think about our services.
This is our Tenant Satisfaction Measures (TSMs) survey and used to be called the STAR survey.
ARP Research carry out our annual tenant satisfaction survey to help us understand tenant satisfaction with the services we provide.
The survey was sent to a sample of 3,000 tenants and we had a good response rate of 31%.
View our latest Tenant Satisfaction Measures results.

What the survey tells us
Overall satisfaction with the services provided by Berneslai Homes has increased to 77% compared to 75% in 2024 and our score is above our peers when compared against similar landlords. Five out of the twelve TSM regulatory measures show significant increases, with improvements in the scores for repairs, communication with tenants and how we make a positive contribution to local neighbourhoods.
However, we know there’s room for improvement and in the coming months we’ll be reviewing the results with colleagues to identify actions, including looking at where scores differ by specific groups. Take a look at some of our headline results below and thanks to everyone who completed the survey!
Satisfaction by age group
The survey showed older residents rating higher levels of satisfaction in many areas including:
overall satisfaction
satisfaction with time taken to complete last repair
satisfaction that their home is well maintained
satisfaction that they're treated fairly and with respect
Tenants aged 35 – 49 appear to be the less satisfied with our services, and we’ll be doing additional research to understand why.

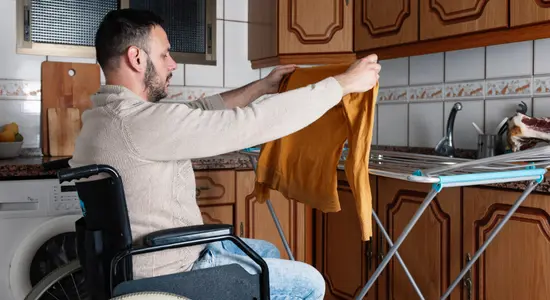
Satisfaction by disability status
Tenants with a disability reported lower satisfaction scores across several measures, including:
satisfaction that communal areas are clean and well maintained
satisfaction that we make a positive contribution to neighbourhoods
satisfaction with our approach to handling ASB
being kept informed and treated fairly
We’re committed to improving these scores to make sure our services are inclusive and we can adapt to tenants’ needs.
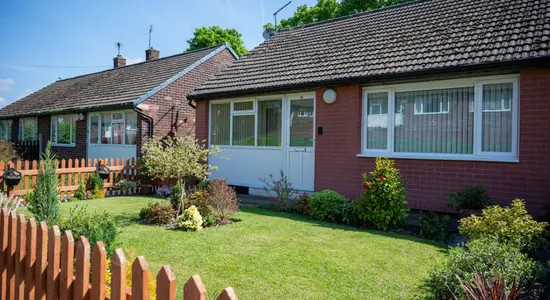
Satisfaction by property type
Tenants who live in bungalows scored the highest on overall satisfaction and a range of measures linked to repairs and how we communicate with them.
Alternatively, this year’s results showed lower scores from tenants who live in houses with:
62% of respondents who live in houses stating that we listen and act on their views.
57% of respondents who live in houses stating that we make a positive contribution to their neighbourhood.
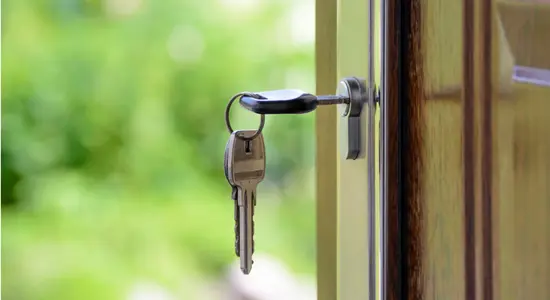
Satisfaction by tenancy length
This shows a mixture of results with those having a tenancy with us for under a year scoring more highly on a range of measures, including:
80% overall customer satisfaction
87% satisfaction that they’re treated fairly and with respect
Both those who’ve held a tenancy with us for under a year and over 21 years showed positive scores in how we maintain their home. However, those who’ve held a tenancy with us for 3-10 years showed lower scores in a range of measures including:
our approach to handling anti-social behaviour
the time taken to complete the last repair
satisfaction that their home is safe
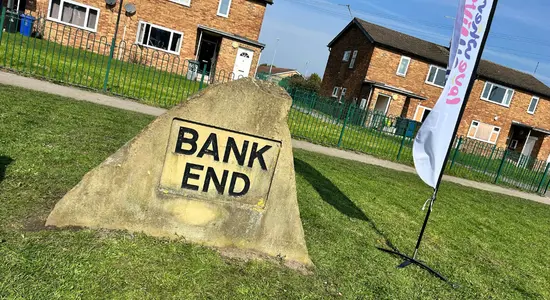
Satisfaction by area
Tenants in the North East and Dearne area rated the highest score for overall satisfaction at 79%. However, residents in the South area rated the lowest on:
overall satisfaction
satisfaction that their home is well maintained
satisfaction that we listen to their views and acts on them
We’re keen to understand why our TSM results show differences in how tenants in each area view our services and we'll work with colleagues to make improvements.

Satisfaction by ethnic background
Tenants form diverse background showed higher levels of satisfaction across a few measures including:
89% satisfaction that they’re treated fairly and with respect
79% satisfaction that we make a positive contribution to their neighbourhood
86% that their home is well maintained
However, tenants from White British background showed lower scores on a range of measures, including:
49% satisfaction with our approach to handling anti-social behaviour
63% satisfaction that we listen to their views and act on them
71% that their home is well maintained